

- 01326 375705


17th January, 2017
The Office for National Statistics (ONS) publishes data on UK Business activity, size and location annually. In March 2016 there were 2,554,510 million businesses registered in the UK for VAT and/or PAYE (Pay As You Earn). Compared with 2,449,415 million in March 2015 this is a rise of around 105,000 (4.3%).
Between 2015 and 2016, all regions saw an increase in the number of VAT and/or PAYE businesses. In the South West the total number of businesses went from 220,825 in March 2015 to 226,575 in March 2015, a rise of 5,750 (2.6%) in total. The number of businesses in Cornwall & Isles of Scilly is estimated to have risen by 330 (1.4%) between March 2015 and March 2016 to 23,475.
In terms of numbers of businesses in Cornwall & Isles of Scilly, this is slightly below but close to the same growth rate as the growth seen from 2014-2015 which was 1.5%. Compared to the growth rate from 2013-2014 (2.9%) the growth rate is about half for both 2014-2015 and 2015-2016. However it is worth noticing that the growth rate hasn’t moved noticeably compared to the decrease seen from 2014-2015.
Compared to the UK as a whole the growth rate of businesses in Cornwall and the Isles of Scilly is about one third where last year the growth rate was about half that of UK overall. London, which has the largest number of VAT and/or PAYE-based businesses has again experienced the largest growth nationwide with a growth rate of 7.2% from 2015-2016.
Table 1: Number of UK VAT and/or PAYE based enterprises by location, 2014 to 2016 (Count given to the nearest thousand)
|
2014 |
% growth |
2015 |
% growth |
2016 |
|
| Cornwall & Isles of Scilly |
22.8 |
1.5 |
23.1 |
1.4 |
23.5 |
| South West |
216 |
2.3 |
221 |
2.6 |
227 |
| UK |
2,361 |
3.8 |
2,449 |
4.3 |
2,555 |
UK wide, the number of companies and public corporations has continued to rise and represents 68.8% of total businesses. The number of sole proprietors and partnerships has continued to decline and now represents 27.4% of total businesses.
In the South West[1], companies make up a lower proportion of businesses, at 60.7%, and sole proprietors and partnerships make up a correspondingly higher proportion, at 35.1%. Non-profit bodies or mutual associations make up 3.4% of businesses in the South West which is broadly in line with the UK average at 3.3%.
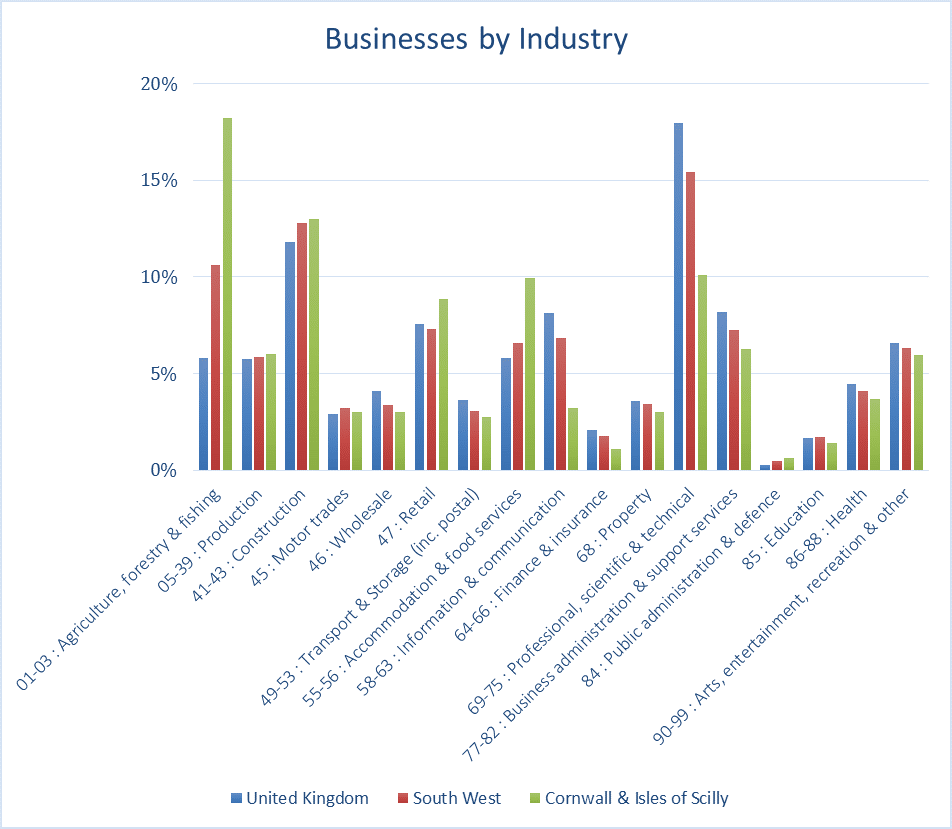
In 2016, agriculture, forestry & fishing remains the largest industry group in Cornwall and Scilly with 18% of all registered businesses. Construction (13%) is still next largest, with accommodation and food services as well as professional, scientific and technical businesses sharing third place with both 10%.
The growth in professional, scientific and technical businesses is following the national trend where this is the largest industry group, with 18% of all registered businesses. This may of course be down to the significant focus and investment in Cornwall and Scilly in such specialist knowledge based industries and at the Cornwall Innovation Centres.
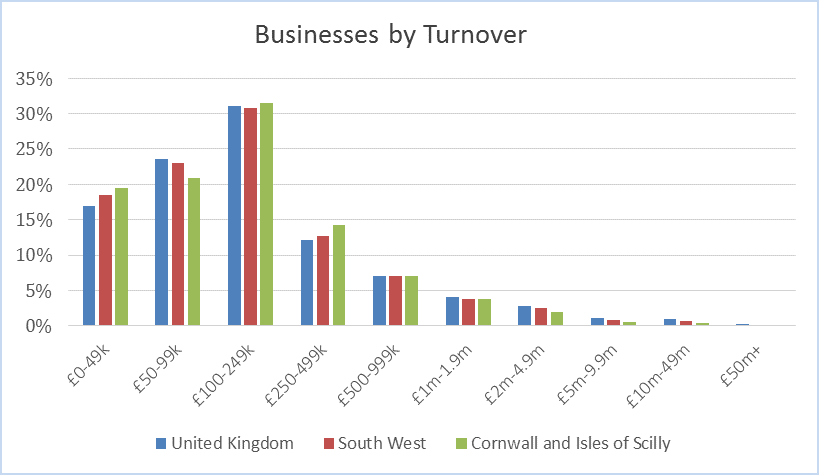
The ONS 2016 data shows that Cornwall & Isles of Scilly still has a higher proportion of businesses in the lowest turnover band (less than £50,000), with 20% compared to the UK average of 17%. It also still has fewer bigger businesses with a turnover of £1m and over – 7.5% of businesses in Cornwall & Isles of Scilly operate at the highest turnover levels compared to 9.2% across the UK as a whole. For businesses within the turnover size band of £100,000 to £499,000 Cornwall & Isles of Scilly has a slightly higher proportion of businesses with 45% compared to the UK average of 43%.
In terms of employment size, the 2016 stats are similar to 2015; Cornwall & Scilly is still representative of the UK average, except:
Also, there is still no conclusive evidence to suggest that Cornwall and Isles of Scilly has a higher proportion of micro entities than the UK as a whole[2]:
North Cornwall, the largest area geographically, still has the greatest number of VAT/PAYE registered businesses with 5,005 in total. Truro and Falmouth come next with 4,305 businesses. South East Cornwall has 3,835 registered businesses followed by St Ives with 3,825 businesses. St Austell & Newquay has 3,600 businesses and Camborne & Redruth has the fewest businesses, with 2,910.
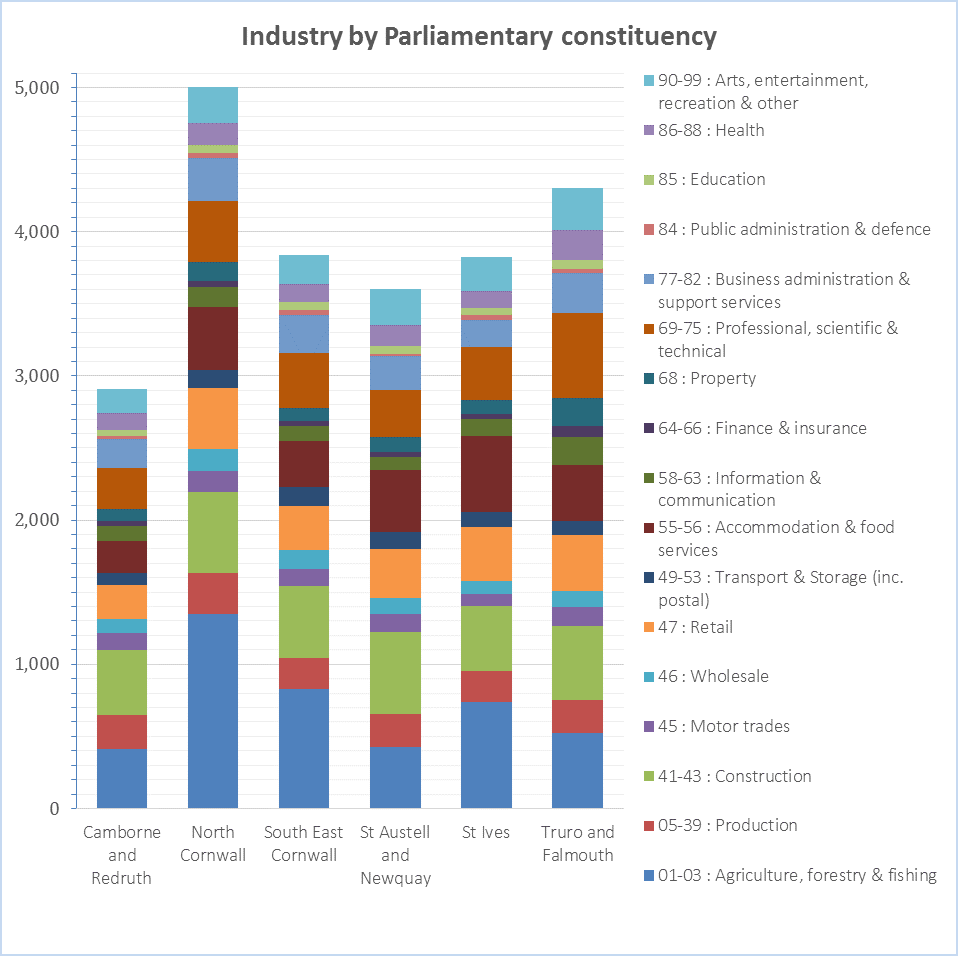
By industry:
In terms of business size – about three quarters of businesses in Cornwall have less than 5 employees. Businesses with 5-9 employees represent the second largest group with close to or just over 15% across Cornwall. North Cornwall has the highest proportion of businesses within the lowest turnover band of less than £50,000.
Camborne and Redruth, and St Austell and Newquay have the highest proportion of businesses employing over 10 people. Camborne & Redruth, followed closely by St Austell and Newquay, also have the highest proportion of businesses with over £1m turnover. In terms of absolute numbers however, Truro & Falmouth have the greatest number of businesses (560) with over 10 employees, followed by North Cornwall (with 520). These numbers are slightly lower than 2015. In terms of turnover size, in absolute numbers North Cornwall has the greatest number of businesses with over £1m turnover (315).
PFA Research conducts the Quarterly Economic Survey (QES) in Cornwall on behalf of Cornwall Chamber and the British Chambers of Commerce. By analysing the results across the last four years, we see a more longitudinal picture and the trends over time…
The following chart shows the net difference between those saying last quarter sales / advanced orders increased or decreased:
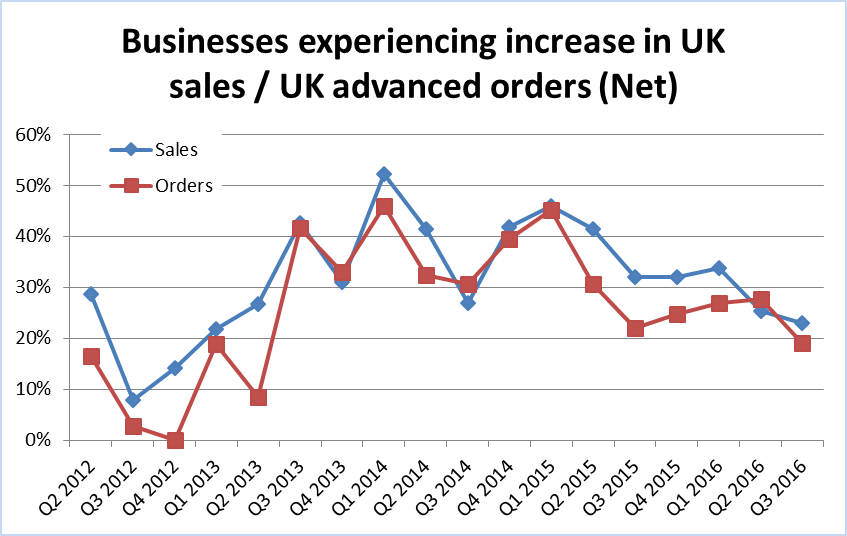
As an indicator of business confidence over the long term, the trend still shows a positive net increase however the balances have been declining slightly throughout 2016.
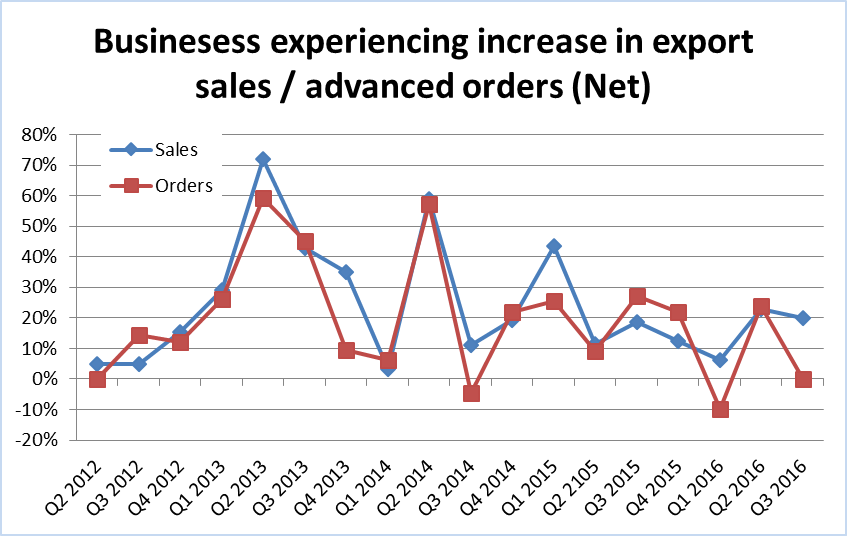
Just over a quarter of businesses who contribute to Cornwall Chamber’s QES are exporters. At the beginning of 2016 the net increase for this group took a large dip and reached negative growth on advanced orders with -10%. By Q2 the net increase went back to positive but after that started to decline again to the point where it has reached 0% growth by Q3 2016.
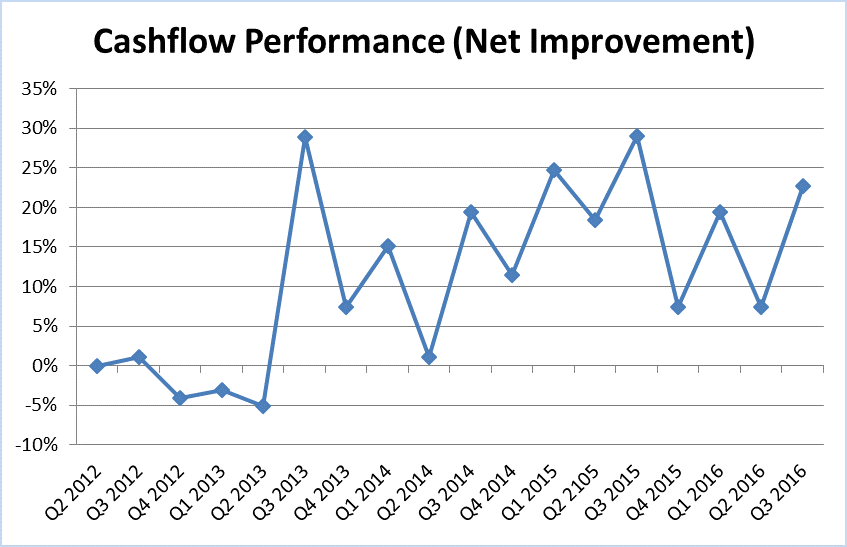
Cornish businesses who responded to the QES report experienced a significant dip in their cashflow position in the last quarter of 2015 after seeing continued improvement in their cashflow position through the first 3 quarters of 2015. During 2016 the cashflow position has improved compared to Q4 2015 but is still relatively far from the peak experienced in Q3 2015.
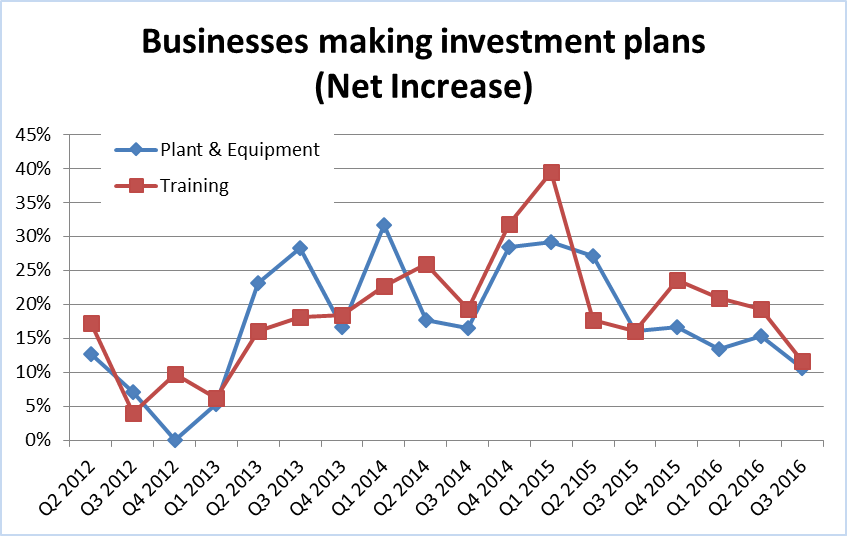
Businesses are still making investment plans for plant, machinery and equipment, and training however not at the same level as previous years. The numbers have gone down in particular in Q3 2016 which could be caused by a more apprehensive attitude in more uncertain times:
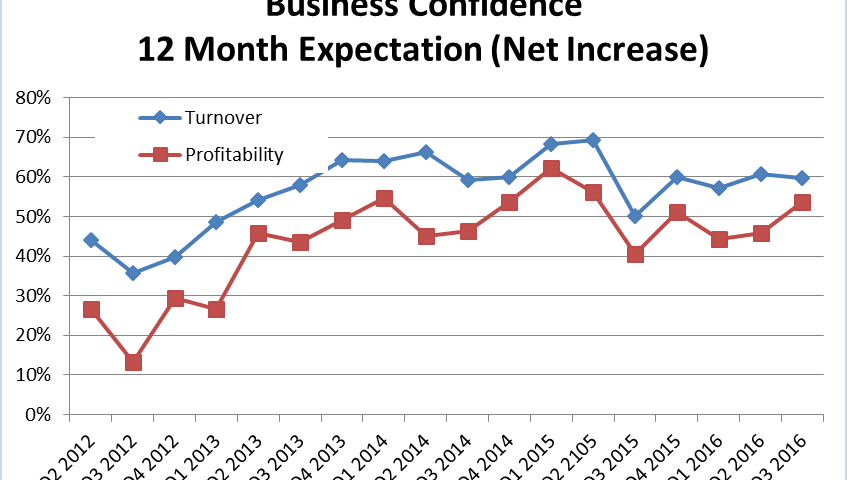
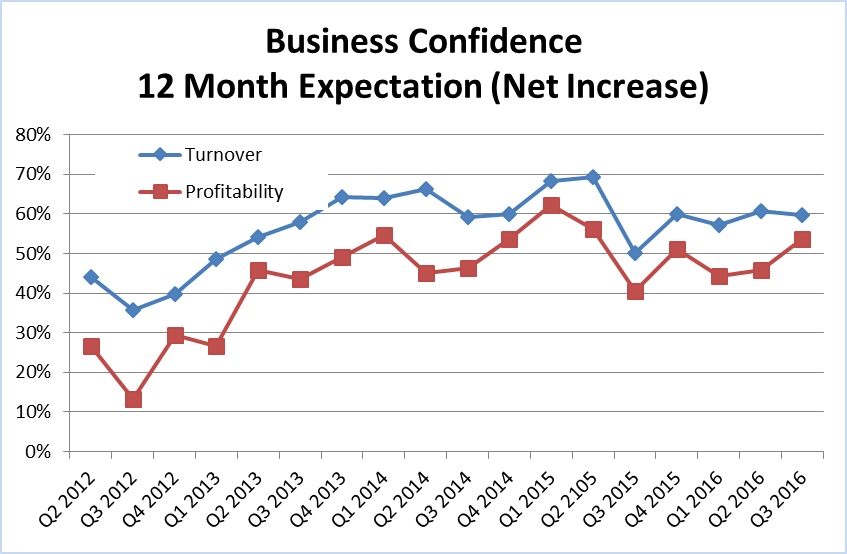
The QES questions relating to turnover and profitability relate to business owners’ expectations for the next 12 months.
This ‘snapshot’ of business confidence at quarterly intervals over the last four years shows a steady, slowly rising confidence level over the last year compared to the noticeable decline seen in Q3 of 2015:
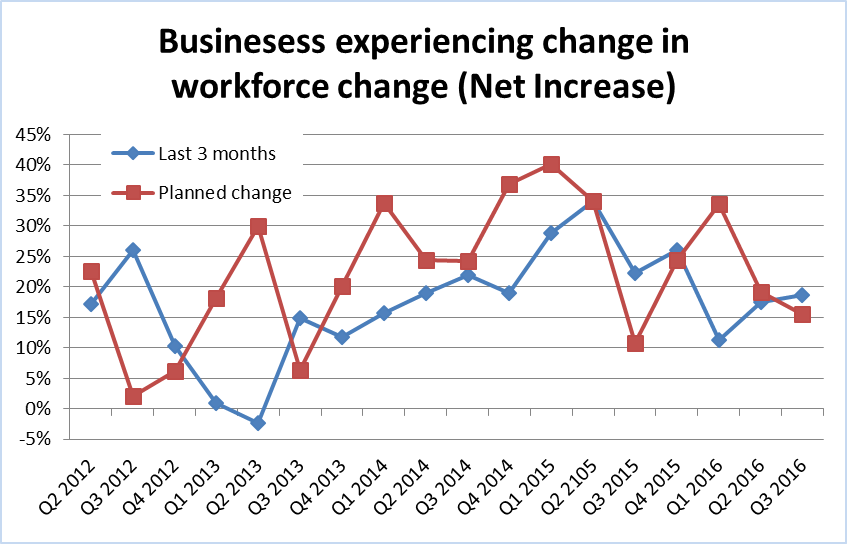
At the beginning of 2016 there was quite a big gap in terms of workforce changes experienced and planned workforce changes. Where recruitment had gone down significantly in Q1 2016 the plans for future recruitment were more optimistic. Following this trend the actual workforce changes over the past 3 months have gone up by Q3 2016. Plans for recruitment have gone down since the beginning of the year which again might be down to a more apprehensive attitude overall:
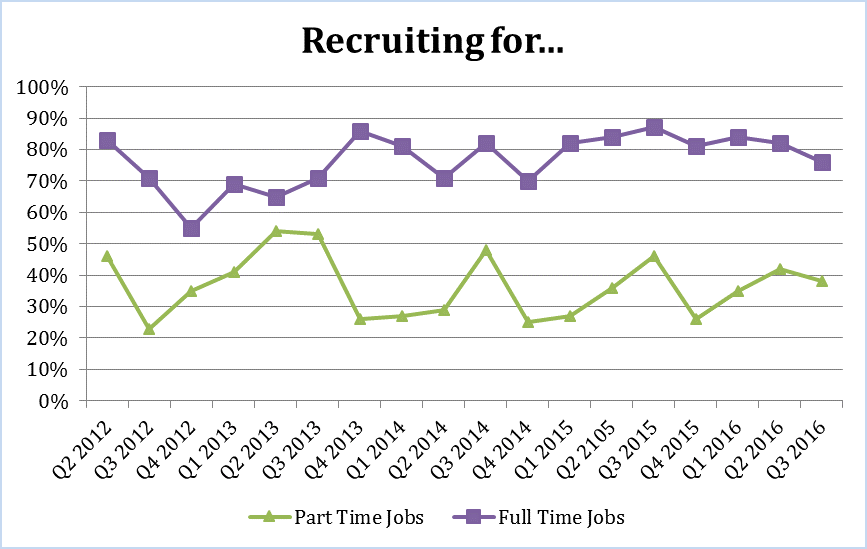
The types of positions looking to be filled remain fairly stable. When taking a look at the last three years the seasonality trend is apparent, where recruitment for part-time jobs increases by Q3 followed by a similar decrease in part-time recruitments for Q4:
Growth in businesses in Cornwall continues but at a relatively low rate compared to a couple of years ago. However it is comforting to see that the growth rate hasn’t gone down since 2015 compared to the radical decrease experienced from 2014-2015. The agricultural industry is still the largest industry in Cornwall but the professional, scientific and technical sector continues to emerge and is now matching levels of the accommodation and food sector, together representing the third largest sectors in Cornwall.
Cashflow performance has gone down since its Q3 peak in 2015 but overall business confidence has been rising slowly but steadily. However the plans for future investments and recruitment have been decreasing especially since Q2 2016. This might be caused by a more apprehensive and conservative approach due to the outcome of the EU referendum back in June 23rd this year
The success of new initiatives must continue to be for growth and attraction of bigger businesses to Cornwall to encourage more and higher value employment and investment in skills and training.
[1] Figures for Cornwall & Isles of Scilly alone are not available.
[2] It is not possible to cross analyse ONS statistics at a business level. The strict definition as to what constitutes a ‘micro-entity’ is where at least two of the following criteria are met: