

- 01326 375705


1st December, 2015
The Office for National Statistics (ONS) publishes data on UK Business activity, size and location annually. In 2015, the ONS extended its coverage of businesses to include a population of solely PAYE based businesses totalling 105,000 businesses, the addition of which brings the total number of UK businesses to 2,449,410 and, in the South West, 220,825.
The number of VAT and/or PAYE businesses in Cornwall & Isles of Scilly is estimated to have risen by 350 (1.5%) between March 2014 and March 2015 to 23,145.
In terms of numbers of businesses, this is nearly half the rate of growth seen in the previous year from 2013-2014, half that of the UK as a whole (3.8%) and still far behind London, which experienced the greatest growth of 6.9% between 2014 and 2015.
Table 1: Number of UK VAT and/or PAYE based enterprises by location, 2013 to 2015[1] (Count given to the nearest thousand)
| 2013 | % growth | 2014 | % growth | 2015 | |
| Cornwall & Isles of Scilly | 22.2 | 2.9 | 22.8 | 1.5 | 23.1 |
| South West | 208 | 3.8 | 216 | 2.3 | 221 |
| UK | 2,250 | 4.9 | 2,361 | 3.8 | 2,449 |
UK wide, the number of companies and public corporations has continued to rise and represent 66.8% of total businesses. The number of sole proprietors and partnerships has continued to decline and now represents 29.5% of total businesses.
In the South West[2], companies make up a lower proportion of businesses, at 58.9%, and sole proprietors and partnerships make up a correspondingly higher proportion, at 37.0%. Non-profit bodies or mutual associations are still broadly in line with the UK average, at 3.4%.
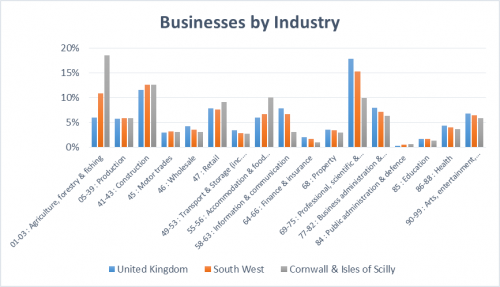
In 2015, agriculture, forestry & fishing remains the largest industry group in Cornwall and Scilly with 18% of all registered businesses, but this has reduced slightly since 2014. Construction (13%) is still next largest, but accommodation and food services (10%) has been matched in proportion by professional, scientific and technical businesses which has overtaken retail (9%) in numbers of businesses.
The growth in professional, scientific and technical businesses is following the national trend where this is the largest industry group, with 18% of all registered businesses. This may of course be down to the significant focus and investment in Cornwall and Scilly in such specialist knowledge based industries and at the Cornwall Innovation Centres.
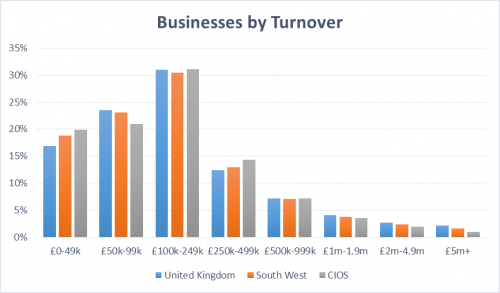
The ONS 2015 data shows that Cornwall & Isles of Scilly still has a higher proportion of businesses in the lowest turnover band (less than £50,000), with 20% compared to the UK average of 17%. It also still has fewer bigger businesses – 7% operate at the higher turnover levels (over £1m) compared to 9% across the UK as a whole.
In terms of employment size, the 2015 stats are similar to 2014; Cornwall & Scilly is still representative of the UK average, except:
Also, there is still no conclusive evidence to suggest that Cornwall and Isles of Scilly has a higher proportion of micro entities than the UK as a whole[3]:
North Cornwall, the largest area geographically, still has the greatest number of businesses (VAT/PAYE registered) with over 5,000 and 18% more than Truro and Falmouth which comes next, with 4,200 businesses. St Ives and South East Cornwall both have 3,800, St Austell & Newquay has 3,500 and Camborne & Redruth has the fewest businesses, with 2,800.
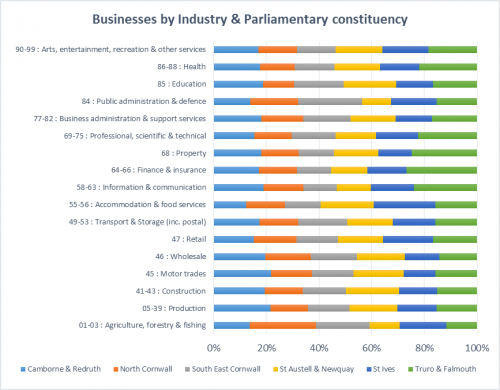
By industry:
In terms of business size – at least three quarters of businesses in South East Cornwall and North Cornwall have less than 5 employees and businesses in these areas also have the highest proportion in the lowest turnover band of less than £50,000.
Camborne and Redruth, and St Austell and Newquay have the highest proportion of businesses employing over 10 people. Camborne & Redruth also has the highest proportion of businesses with over £1m turnover! In terms of absolute numbers however, Truro & Falmouth have the greatest number of businesses (565) with over 10 employees, followed by North Cornwall (with 510).
PFA Research conducts the Quarterly Economic Survey (QES) in Cornwall on behalf of Cornwall Chamber and the British Chambers of Commerce. By analysing the results across the last three years, we see a more longitudinal picture and the trends over time…
PFA Research conducts the Quarterly Economic Survey (QES) in Cornwall on behalf of Cornwall Chamber and the British Chambers of Commerce. By analysing the results across the last three years, we see a more longitudinal picture and the trends over time…
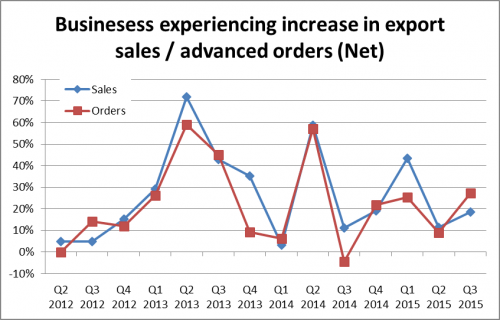
The following chart shows the net difference between those saying last quarter sales / advanced orders increased or decreased:
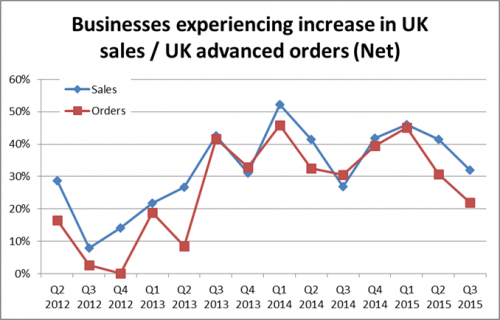
As an indicator of business confidence over the long term, the trend still shows a positive net increase however the picture in the last two quarters is less positive than the start of the start of 2015.
Just over a quarter of businesses who contribute to Cornwall Chamber’s QES are exporters, and confidence amongst this group is more volatile, but looks to be improving in the second half of this year from a dip in Q2:
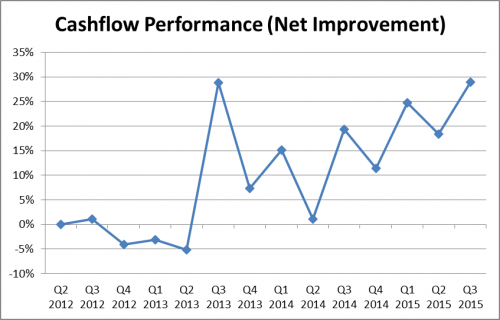
Cornish businesses who responded to the QES report continued improvement in their cashflow position throughout 2015 and in Q3 it has matched the peak of two years ago.
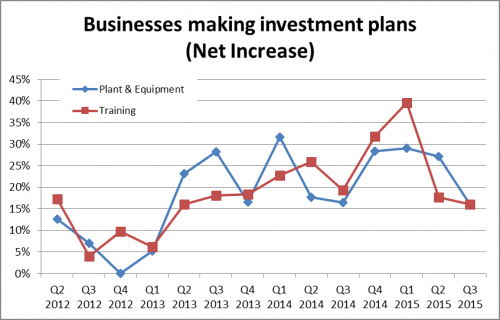
Businesses are still making investment plans for plant, machinery and equipment, and training however not at the same level at the start of this year. This is perhaps due to less availability of match funding as many EU investment projects came to an end in the first half of the year.
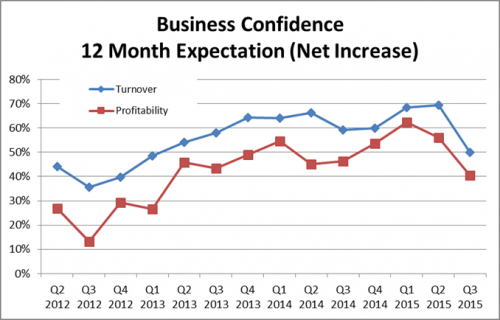
The QES questions relating to turnover and profitability relate to business owners’ expectations for the next 12 months.
This ‘snapshot’ of business confidence at quarterly intervals over the last 3 years shows a marked decline in the last quarter following the growing optimism seen over the last two years and despite the strong start in 2015.
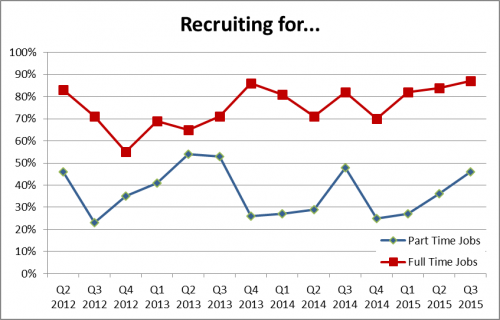
The decline in business confidence is mirrored in plans for recruitment, with growth in employees lessening in the last quarter:
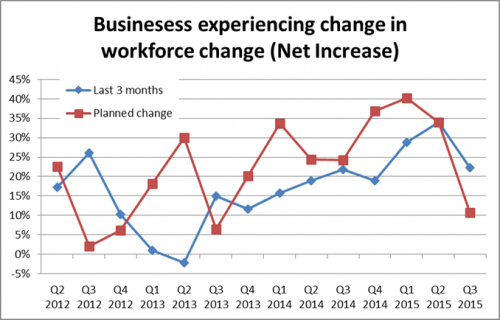
The types of positions looking to be filled remain pretty stable, but a relative increase in recruitment for part time jobs compared to full time positions, perhaps as a flexible resource during more uncertain times.
Growth in businesses in Cornwall continues and it is especially heartening to see the professional, scientific and technical sector emerging to match levels of accommodation and food sector businesses as the third largest industry in terms of business numbers, following the national picture.
Whilst export, cashflow and recruitment is still buoyant, there has been a recent decline in business confidence overall, which may be aligned to the current ‘gap’ in business support from EU investment programmes.
The success of new initiatives, as ever, will be to grow and attract bigger businesses to Cornwall to encourage more and higher value employment and investment in skills and training.
The next Cornwall Chamber Quarterly Economic Survey is due in February 2016 and responses are encouraged from local businesses – see www.cornwallchamber.co.uk
An interactive map of all ONS business data for Cornwall & Isles of Scilly is available here.
All ONS figures have been rebased to include additional businesses applying the ‘inquiry stop 6 fraction’. % growth figures calculated from raw data. Old v new rebased figures are as follows:
| 2012 | 2013 | 2014 | 2015 | |
| Cornwall & IOS | ||||
| Old | 21,100 | 21,195 | 21,665 | 21,910 |
| New | Not available | 22,155 | 22,795 | 23,145 |
| South West | ||||
| Old | 207,465 | 211,700 | ||
| New | 208,000 | 215,885 | 220,825 | |
| UK Total | ||||
| Old | 2,263,640 | 2,344,575 | ||
| New | 2,250,000 | 2,360,525 | 2,449,410 |
[1] It is not possible to cross analyse ONS statistics at a business level. The strict definition as to what constitutes a ‘micro-entity’ is where at least two of the following criteria are met:
[2] Figures for Cornwall & Isles of Scilly are not available.
[3] It is not possible to cross analyse ONS statistics at a business level. The strict definition as to what constitutes a ‘micro-entity’ is where at least two of the following criteria are met: