

- 01326 375705


28th September, 2015
As plans are being formed for the next round of EU funded business support programmes in Cornwall & Scilly, we’ve analysed data from the Office for National Statistics to provide deeper insights into the business make up in each locality, enabling investment to be focussed to deliver the most impact.
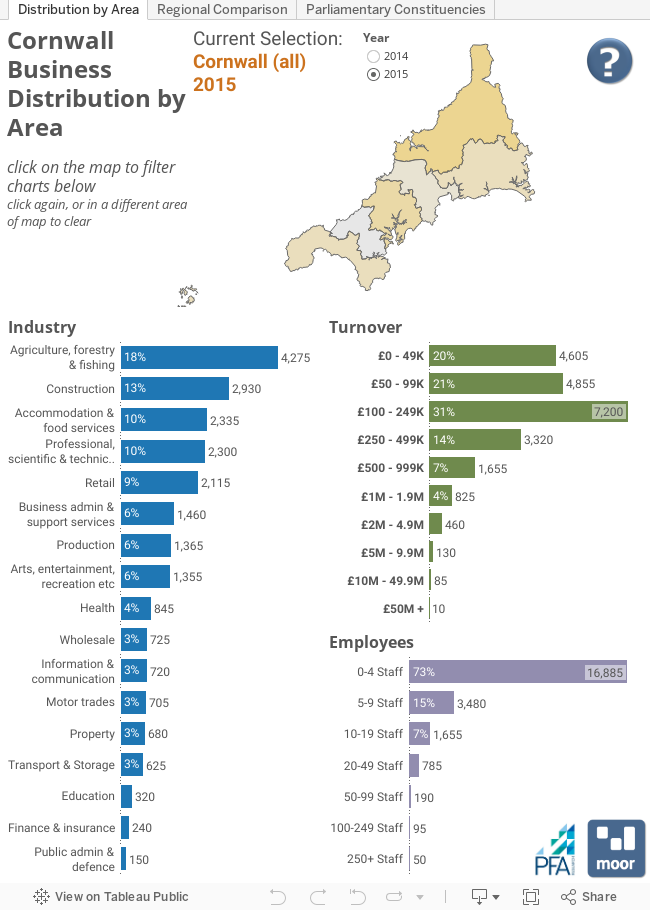
Data visualisation experts Moor Consulting, have put together this interactive map showing data by Parliamentary Constituency Area on overall numbers of businesses, their relative employment numbers, turnover and what particular industry sector support is needed in each locality, along with regional and national comparisons.
Headline stats
• North Cornwall has the highest volume of businesses, 19% more than Truro & Falmouth
• South East Cornwall has the highest proportion of businesses with under 10 employees (91%), and Camborne & Redruth the lowest (85%)!
• South East Cornwall and North Cornwall have more businesses with turnover less than £100,000 than the other areas (46-7% compared to 42-3%)
• Truro & Falmouth is the only area that comes close to the national picture where professional, scientific & technical businesses are in the largest volume.
See the Moor Consulting blog for more examples of data visualisations.