

- 01326 375705


12th May, 2015
The Office for National Statistics publishes annual data on UK business activity, size and location. In Cornwall we hear a lot about our own performance and growth because of the EU funding and focus, but it is also important to put things into a UK national context…
The number of VAT and/or PAYE businesses in Cornwall & Isles of Scilly is estimated to have risen by nearly 500 (2.2%) between March 2013 and March 2014 to 21,665.
This mirrors an increase across all regions of the UK (except Northern Ireland), in line with the performance of the UK economy – but growth in Cornwall and Scilly was half that of the UK as a whole.
Table 1: Number of UK VAT and/or PAYE based enterprises by location, 2012 to 2014. (Count given to the nearest thousand.)
| 2012 | % growth | 2013 | % growth | 2014 | % growth | |
| Cornwall & Isles of Scilly | 21.1 | 1.0 | 21.2 | 0.5 | 21.7 | 2.2 |
| South West | 201 | 2.0 | 201 | 0.3 | 207 | 3.1 |
| UK | 2,149 | 3.3 | 2,168 | 0.9 | 2,264 | 4.4 |
UK wide, the number of companies and public corporations has continued to rise and represents 66.1% of total businesses. The number of sole proprietors and partnerships has continued to decline and now represents 29.9% of total businesses.
In the South West, companies represent a lower proportion of all businesses – 58.4% – and sole proprietors and partnerships make up a correspondingly higher proportion, at 37.3%. Non-profit bodies or mutual associations are in line with the UK average, at 3.6%.
Agriculture, forestry & fishing remains the largest industry group in Cornwall and Scilly, with 19% of all registered businesses, followed by construction (13%), accommodation and food services, and retail (both 10%).

UK wide, Professional, scientific and technical is the largest industry group, with 17.5% of all registered businesses, whilst in Cornwall this is the fifth largest group, representing just 9% of registered businesses.
Cornwall & Isles of Scilly has one of the highest proportions of businesses with low (less than £50,000) turnover in the country, and conversely, a lower proportion in the highest turnover bands (over £500,000).
Measured by employment size band, Cornwall & Scilly’s businesses are representative of the UK average, except there is:

It is also often cited that Cornwall & Isles of Scilly has a higher proportion of micro entities than the UK as a whole but there is no striking evidence to demonstrate this.
The strict definition as to what constitutes a ‘micro-entity’ is where at least two of the following criteria are met:
Although it is not possible using the data available to cross-analyse individual business results to see if they meet the micro-entity criteria, the ONS data shows that:
Perhaps an eye opener to some, North Cornwall is home to the greatest number of businesses (VAT/PAYE registered) with over 4,700, but it is also the largest Parliamentary Constituency area. Truro and Falmouth comes next, with nearly 4,000, St Ives and South East Cornwall both have 3,500, St Austell & Newquay has 3,200 and Camborne & Redruth has the lowest number of businesses, with 2,600.
There are no significant differences in the size of business by number of employees across constituency areas.

Cornwall Chamber of Commerce’s “A Business Plan for Cornwall” was created from in depth consultation with local businesses by extending its usual Quarterly Economic Survey (QES).
PFA Research conducts the QES in Cornwall on behalf of Cornwall Chamber and the British Chambers of Commerce. By looking specifically at the standard QES data over the last three years, we see a more longitudinal picture and some interesting trends emerging…
The following chart shows the net difference between those saying last quarter sales / advanced orders increased or decreased:

As an indicator of business confidence over the long term, this shows a growing level of optimism in Cornwall & Scilly after the 2011 recession.
About a quarter (27% in Q1 2015) of businesses who contribute to Cornwall Chamber’s QES are exporters, accounting for about one fifth (19%) on average of their total sales. Amongst these exporters, the situation is more volatile – confidence decreased in late 2013/ early 2014, but is back on an upward trend in late 2014/ early 2015:

Cornish businesses who responded to the QES reported a worsening cashflow position throughout 2012. In mid 2013 things dramatically improved and although volatile, businesses’ cashflow position has become increasingly buoyant.

Investment plans for plant, machinery and equipment, and training mirrored the prevailing cashflow situation, with a dip in late 2012 followed by steady, continued recovery from 2013 onwards.

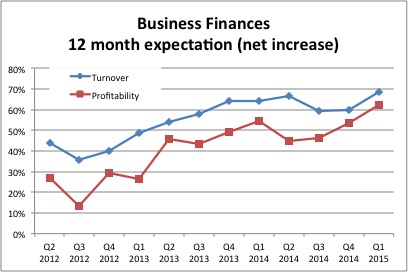
The QES questions relating to turnover and profitability relate to business owners’ expectations for the next 12 months.
This ‘snapshot’ of business confidence at quarterly intervals over the last 3 years clearly shows growing optimism in the local business community since the 2012 dip and a particularly strong start to 2015.

The chart below shows the net increase (decrease) on last quarter’s workforce and the expected change over the next three months:

Again, the long term trend shows a positive picture, with actual workforce growing over the last year and a half, and plans for the future to do the same.
The types of positions looking to be filled remain pretty stable, with an overall larger number of full time roles compared to part time roles and a stable trend in the proportion of each.

There are clear indicators that Cornwall & Isles of Scilly is seeing recovery and business confidence is growing steadily. Contributors to Cornwall Chamber’s QES report increases in trade, bettering cashflow and an overall expectation of improved finances. As a result they are investing in their equipment and staff.
Positive growth of 2.2% is being seen in overall numbers of businesses but this is still half of the UK average of 4.4%.
Whilst a lot of our focus for future business support is on emerging high growth sectors such as marine renewables and creative industries, it is important to recognise that in volume terms, traditional sectors such as agriculture, construction, tourism and retail still represent the highest proportion of businesses in Cornwall & Scilly.
North Cornwall parliamentary constituency has a higher number of businesses than Truro & Falmouth and numbers of employees per business is fairly evenly spread throughout the County.
There is no evidence to suggest that Cornwall & Isles of Scilly has a higher proportion of micro entities than the UK as a whole.
The next Cornwall Chamber Quarterly Economic Survey is due in May 2015 and responses are encouraged from local businesses – see www.cornwallchamber.co.uk for more information.
For more information on this article and data sources, contact Emma Lydon on 01326 375705 or email info@pfa-research.com